1.1 Test Technology Verification Scheme and Verification Standard
In order to verify the reliability of the system, we tested the 1M thick film resistor with the voltage noise test using the test method in Figure 3.9, where Rx is the thick film resistor with a resistance of 1M, Rt is 400K wirewound resistor, R1 It is a 25K variable winding resistance and R2 is a 10K winding resistance.
It should be noted here that the resistance values ​​of the above resistors are all nominal capacitance values, and the actual resistance value will be different from the nominal value. Therefore, in actual testing, it is necessary to adjust R1 until the bridges on both sides are balanced. The performance of the bridge balance is that there is no DC offset in the amplifier input signal. The amplifier uses a self-designed AD743 amplifier circuit. The verification standard uses a qualitative verification standard and a quantitative verification standard.
If the test result is correct, we will see a significant 1/f noise signal curve in the low frequency band of the signal power spectral density, or a superposition curve of the 1/f noise signal and the burst noise. This curve will follow the frequency. It increases and decreases, and in logarithmic coordinates, its slope is approximately -1. At the same time, we also see a straight line in the slightly higher frequency part of the curve, which is thermal noise. For quantitative verification standards, we use the famous Hugue formula (2-9). According to equation (2-9), we can easily estimate that the voltage power spectrum noise of the device should be proportional to the square of the bias voltage applied across the device.
1.2 Test Technology Verification Results
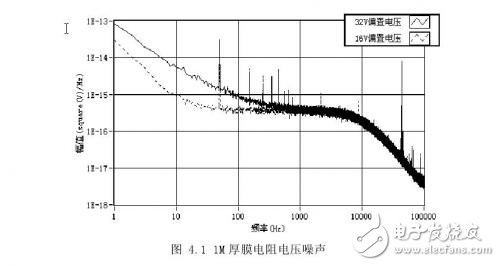
We tested the voltage noise of the samples under DC bias of 16V and 32V respectively. The test results are shown in Figure 1. The peak at the frequency point of the integer multiple of 50Hz is the harmonic interference introduced by the computer power signal. From the figure, we can clearly see that the trend of the two curves at the low frequency end is consistent with the characteristics of 1/f noise. The result measured by this test technique is the 1/f noise of the device.
Figure 1 only verifies the test method by qualitative analysis. Next, we combine the specific data and low-frequency noise theory to prove the reliability of the test technology. The frequency point data in the curve is now listed in the following table:
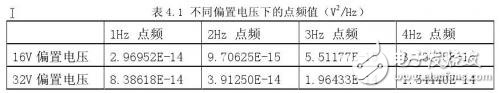
From the above table, we can see that when the bias voltage at both ends of the sample is doubled, the value of the noise power spectral density becomes about 4 times, which is consistent with the Hugue formula, thus indicating the design in this study. The new testing technology is reliable.
This Automation curtain is specially designed for automation industry. SDKELI LSC2 light curtain is designed for automation field, with small size, compact structure and strong anti-interference ability, and the product meets IEC 61496-2 standards. The automatic light curtain is with reliable quality and very competitive price. It has been used in many factories and has replaced curtains from Sick, Omron, Banner, Keyence, etc.
Automatic Light Curtain,Laser Light Curtain,Automation Light Beam Sensor,Automatic Infrared Beam Sensor,Infrared Beam Curttain Sensor,Infrared Beam Sensor
Jining KeLi Photoelectronic Industrial Co.,Ltd , https://www.sdkelien.com