Generally, a hybrid vehicle has both an internal combustion engine and an electric motor drive system, and a power semiconductor module is utilized to realize speed adjustment of the electric motor. Generally, the cooling mode of the power semiconductor module on the vehicle is mainly air cooling and liquid cooling. Hybrid systems designed by different car manufacturers are very different and directly comparable. In addition to the cooling system, power semiconductor module packaging and even semiconductor technology itself are different.
This article refers to the address: http://
To make these systems more comparable, this study used a generic "base power module" called HybridPACK for different cooling systems. A basic set of input parameters, such as drive cycles, motor types, and even semiconductor electrical characteristics, is used in the configuration. At the same time, to simplify the calculation, the impact of different driving strategies is ignored.
In power electronic systems, power semiconductor module temperature and temperature fluctuations have a greater impact on reliability. To this end, based on the power loss calculation and thermal simulation model of the power semiconductor module. A program was developed to calculate the temperature during the entire driving cycle.
By calculating the temperature distribution from the power semiconductor module to the cooling system, it is possible to evaluate the thermal stresses experienced by various parts of the module, such as solder joints or bonding points. By converting thermal stress into reliability test data, the lifetime of the power semiconductor module can be predicted.
From driving cycle to reliability test
Reliability test
During the service life, the module is subject to passive temperature fluctuations caused by the environment (climate) and active temperature cycling caused by the heating of the module. Temperature cycling and power cycling tests can simulate the effects of the above conditions on module life.
Temperature cycling: In the temperature cycling test, the ambient temperature of the power semiconductor module is changed without electrical stress, including (TST: thermal shock test) and (TC: thermal cycle test). This test is primarily used to evaluate the reliability of solder joints and to assess the tolerance of modules to temperature variations that may occur during storage, transportation or use.
Power cycling: Power cycling (PC) testing can be used to determine the resistance of thermal and mechanical stresses to the internal semiconductor chip and internal connection points of the power module. Periodic application of current can cause rapid temperature changes that can cause the mechanical position of the bond line to fluctuate. The power cycle test is representative of the expected life expectancy analysis under high temperature conditions [1].
The main fault caused by thermal stress is the internal welding fatigue of the IGBT module and the drop of the weld line.
Research methods
Figure 1 shows the set of key electrical parameter characteristics of the power module under specific operating conditions based on the cooling conditions and driving strategy (driving condition curve, motor and driving control) information of the inverter system, and then calculates the typical number of cycles. To assess the life of the power module, several red parameters are variables in this study.
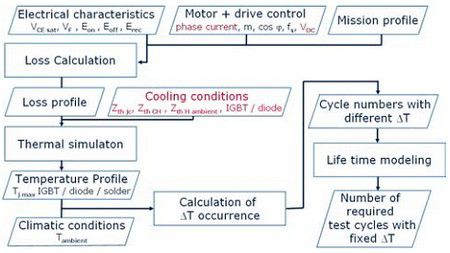
Figure 1: General method for calculating the number of equivalent test cycles. In this study, only the red parameter is a variable.
Basic condition (input parameter)
In order to be unaffected by driving conditions, motor characteristics and chip characteristics, a common input parameter set was chosen.
A power semiconductor module widely used in the industry was selected. This type of module is specifically designed for use in mild hybrid electric vehicle applications up to 20 kW [2]. Designed for operating temperatures up to 150°C, the module is designed for 6-in-one IGBTs with a maximum current rating of 400A/650V.
Typical vehicle driving cycle conditions include multiple start-stop sequences and a 10-second recovery cycle at 5 full load conditions to plot the task curve. It is also assumed that the module gate drive conditions are ideal, although it is possible to underestimate the power loss in the entire inverter system. Therefore, it is compensated by calculating the power loss (highest temperature) under the worst operating conditions [6].
Calculating power loss
The power loss of the module can be calculated by calculating the static (PDC: conduction) and dynamic (PSW: switching) losses.
When calculating the power loss of the chip during the inverter process, a sine half-wave is used to simulate the heat in the chip. It is based on the calculation method used in IPOSIM [7].
Based on this method, the conduction loss of IGBT3 [8] and diode can be calculated according to the electrical parameters of the module [9] [10]. 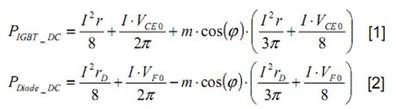
It must be noted that the parameters r, VCE0, rD and VF0 are all dependent on the temperature T.
Using Equations 3 and 4, the switching loss of the power module can be calculated. The switching loss is the product of the switching frequency fsw and the applied voltage VDC, current î and switching energy Eon_nom, Eoff_nom, Erec_nom [11]. 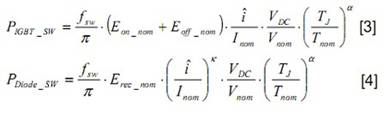
All required parameters are taken from the power module data sheet [12].
Temperature distribution simulation
Typically, an RC network (Cauer model or Foster model) is used to describe the thermal model of a power module system [13]. The heat source and the RC network that simulates the actual component state. The R's and C's values, based on the material properties and dimensions of the system, can be derived from 3D transient finite element simulations, or these values ​​can be directly determined experimentally.
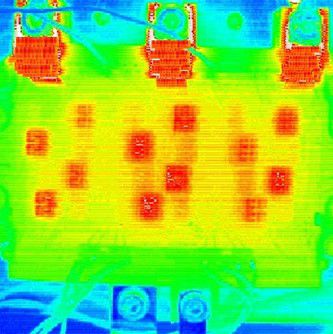
Figure 3: Infrared measurement of IGBT/diode operating temperature
The RC network defines the thermal impedance Zth juncTIon ambient parameter by using the cross-coupling relationship between the chips, and describes the interaction between the IGBT and the diode.
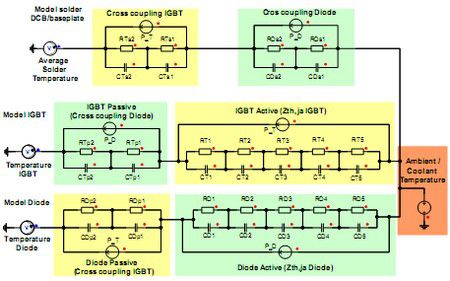
Figure 4: RC Network (Foster Model)
In addition to the typical network, two elements are added to represent the solder layer. Therefore, the power loss of the chip leads to an increase in solder joint temperature [6].
To calculate the welding fatigue caused by thermal cycling, the parameters that must be understood are the solder layer temperature. In addition, a voltage source is introduced into the model to compensate for the effects of ambient temperature changes.
Temperature curve
With the thermal model, the temperature of the IGBT, diode and solder layer can be calculated under load conditions for a specific driving cycle.
At the same time, the environment in which the power semiconductor module is used needs to be considered. For example, for a system installed near the cockpit and cooled by air cooling, the ambient temperature is set to 40 ° C (Fig. 5).
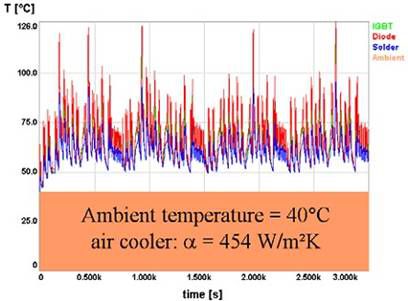
Figure 5: Temperature profile of a power module mounted on an air-cooled radiator during a 3,000-second drive cycle
In this example, the highest temperatures obtained are Tj max IGBT = 118 ° C, Tj max diode = 126 ° C and Tj max solder = 96 ° C (see also Table 2).
The main parameters causing the aging of the solder layer and the weld line are not the temperature itself, but temperature fluctuations. At the same time, an automatic algorithm was added to the simulation to calculate the temperature difference ∆T.
Determine the number of ∆T occurrences
Active Cycle: Figure 6 shows the number of occurrences of a particular temperature fluctuation for a diode in an air-cooled system. Temperature fluctuations below 3 K are ignored because this temperature fluctuation does not significantly reduce component life. Most temperature fluctuations are below 30 ° K. Temperature rise. Only a few cycles will have a higher ∆T. Only 5 significant temperature fluctuations of ∆T > 60°K were observed. These temperature fluctuations are the peaks in Figure 5.

Figure 6: Diode: Number of cycles of different ∆T (α=454W/m2 K) in one driving cycle
Superimposed on the active temperature fluctuations is the passive temperature fluctuation caused by the working environment.
Passive cycling: During operation, an increase in the temperature of the cooling system can also cause temperature fluctuations that must be considered when calculating the life of the component.
Assuming that the car has a service life of 15 years, 2 cycles per day, the power module has to go through a total of 10,950 cycles. The ambient temperature is shown in Table 1, and the outdoor temperature is from 5 days to 25 ° C to 35 days and 309 ° C.
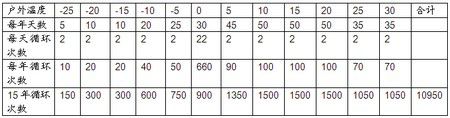
Table 1: Ambient temperature affects the operating temperature, temperature rise causes the cooling system temperature to rise, and the passive temperature fluctuations define the temperature fluctuation of the temperature rise sequence as: the highest temperature in the driving cycle, and the temperature difference from the initial ambient temperature. (See Table 3)
In reliability testing, it is not practical to apply multiple different temperature fluctuations to the device. Therefore, a standard ∆T must be determined.
From the cycle of the vehicle to the power module test cycle
Welding fatigue accelerated aging calculation
Models such as mechanical fatigue, material fatigue, or material deformation are often associated with mechanical stress cycles or temperature changes. This model, called the (modified) Coffin-Manson model, is used to simulate the repeated cycling of power modules, resulting in temperature cycling that results in crack growth in welds or other metals. This often quoted equation clearly shows that fatigue can cause premature failure of the device when the junction temperature fluctuates widely. The derived equation of this equation is the relationship between the temperature cycles of two different thermal cycles (∆Tduty_cycle and ∆Ttest) [14]. Although the reference refers to different indices, the index used in this calculation is 3.3. The model's formula is as follows: 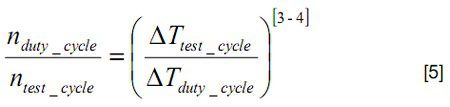
The number of equivalent cycles ntest_cycle corresponding to a specific ∆Ttest can be calculated from the number of load cycles nduty_cycle corresponding to the ∆Tduty_cycle of the curve.
Welding line accelerated life calculation
Equation 6 shows the formula for calculating the equivalent number of cycles for a specific load condition (current I, junction temperature Tj, working time ton, and temperature fluctuation ∆T). 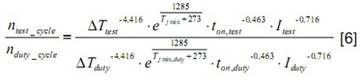
This equation also contains ratios of different temperature differences, but has been modified based on the results of a large number of experiments [15].
Equation 7 is based on Equation 6, the sum of the p-transforms of any load cycle i, yielding the equivalent number of test cycles (conditions: ∆Ttest=100K, Tj, min=50°C, ton, test = 2s and reference current) Itest = 400A). 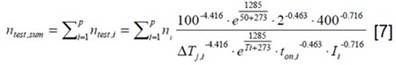
Parameter difference
Cooling condition
Cooling capacity: Comparison of 2 air-cooling systems, 1 liquid cooling system and 1 direct cooling (liquid cooling system with needle radiator) system.
For air-cooled and liquid-cooled systems, it is assumed that thermal grease is applied between the power module backplane and the heat sink.
The cooling capacity of the two cooling systems is compared by the heat transfer coefficient α between the heat sink and the module. (Refer to Table 2: α = 124 W/m2K – air-cooled radiator with weak cooling capacity; α = 454 W/m2K – forced air-cooled radiator; α = 20000 W/m2K – liquid cooling with strong cooling capacity Device)
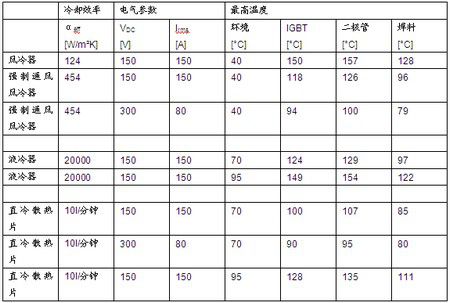
Table 2: System parameter changes
In order to achieve the ideal heat transfer from the power module to the heat sink, a fin heat sink is provided on the bottom of the power module. This type of module is mounted directly on an open liquid-cooled heat sink with fins in direct contact with the coolant. Therefore, it is not necessary to use a thermally conductive paste having a poor thermal conductivity. Since the bottom plate is in direct contact with the coolant, the alpha value is not defined. In this case, the coolant flow rate indicates a different cooling capacity.

Figure 7: Example of a bottom plate with fin heat sink (HybridPACKTM2) [16] [17] and a flat bottom plate
Ambient temperature: As indicated in Section 2.6, the maximum ambient temperature is set to 40 °C for air-cooled systems and 70 °C / 95 °C for liquid-cooled systems (Table 2).
Electrical parameter
Battery voltage: Many car manufacturers are more inclined to set the power battery of a mild hybrid/electric vehicle to a lower voltage. Higher voltages can be achieved by increasing the number of battery cells, but this obviously leads to increased costs and battery weight. In order to understand the effect of battery voltage VDC on the system, two sets of electrical parameters were compared (Table 2).
result
As shown in Fig. 1, the temperature fluctuations during the driving cycle include active temperature fluctuations generated by the operation of the power module and passive temperature fluctuations caused by the working environment. For the chip, the worst case conditions for IGBTs and diodes must be considered. The maximum load for the 5 cycles is on the diode. Therefore, the worst case is analyzed using a diode as an example.
Power Cycle: For the life calculation of the bond wire weld shedding, the maximum temperature of the bond wire is set to the highest chip temperature Tj max. Life cycle modeling calculates the number of equivalent power cycles under passive/active cycling.
By using Equation 7, the number of ∆Ts given in Fig. 6 is calculated, and the number of equivalent active cycles is derived. Similar to the passive cycle, the number of driving cycles is set to 10950.
In order to calculate the number of equivalent test cycles for passive cyclic stress, the number of cycles in Table 1 was converted. The results are shown in Table 3. 
Table 3: Diode Power Cycle: Calculate the equivalent number of cycles representing passive temperature fluctuations
Thermal cycling: A similar process is used with the passive/active temperature cycling described in Section 3.1.
The maximum temperature of the weld layer can be calculated from the driving cycle (Fig. 5). 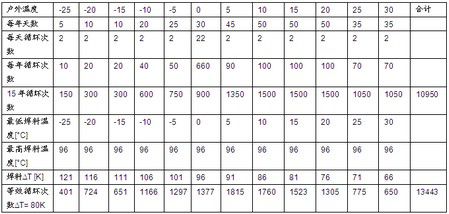
Table 4: Welding layer thermal cycling: equivalent number of cycles of passive temperature fluctuations
Overview
Figures 8 and 9 show the comparison of the number of equivalent test cycles for different parameters.
Power cycle: The number of power cycles shown in Figure 8 (conditions: ∆Ttest=100K, Tj, test=150°C, ton, test = 2s and reference current Itest = 400A), is the number of active/passive fluctuation cycles sum.
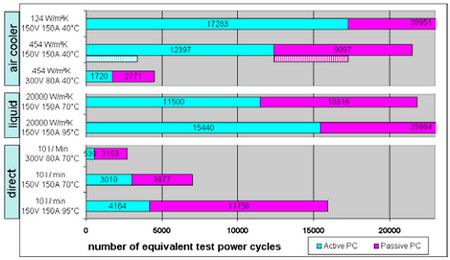
Figure 8: Equivalent power cycle count for a specific drive cycle with different parameters
Thermal cycle: In Figure 9, the number of equivalent test cycles of the thermal cycle test (condition: ∆T = 80K) is the sum of the number of active cycles and the number of passive wave cycles.
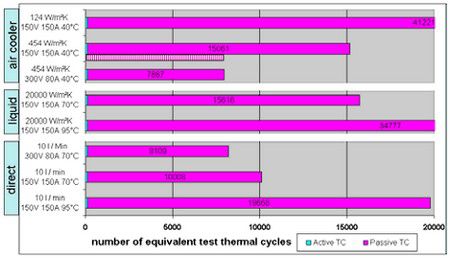
Figure 9: Equivalent thermal cycle times for specific driving cycles with different parameters
In all cases, the effects of active cycling are negligible. ∆T, which has a relatively high passive temperature fluctuation, has a small temperature fluctuation of the soldering layer during operation (< 55 ° C, forced air cooling).
statement
Although the trends in the two trials are very similar, it is not possible to compare two reliability tests because the higher the ∆T in these two trials, the more the number of equivalent test cycles.
1) The better the cooling capacity, the lower the reliability requirements. (Of course, anyone can make such a simple statement, the purpose of this article is to show how much cooling capacity has an impact on reliability requirements.)
2) When the ambient temperature is 40 ° C, the performance of forced air cooling is similar to that of the liquid cooler at 70 ° C ambient temperature.
3) Increasing the coolant temperature from 70 ° C to 95 ° C will double the number of equivalent cycles. The inverter must be equipped with a separate (independent) cooling circuit. With conventional mounting and joining techniques, it is not possible to achieve a design that uses 125 °C engine coolant cooling.
4) Even if the module is not working, the outdoor temperature change will cause temperature fluctuations in the solder layer.
5) Modules that use direct cooling and heat dissipation will greatly reduce the reliability requirements of the module.
6) Increasing the battery voltage can reduce the power cycle requirement of the air cooling system by 4 times and the heat requirement by 40%.
7) Better cooling capacity can mitigate the effects of bus voltage fluctuations.
8) Avoid five 10 second long temperature cycles under full load conditions, which can reduce the power cycle requirement by 60% and the thermal cycle by 40% (for forced air cooling, compare Figure 8 and Figure 9) The dotted line in the column).
The last two statements indicate that it is necessary to adopt a global system approach to the development of hybrid vehicles, including driving strategies, cooling systems, battery voltages, and module cooling capabilities. Automotive manufacturers, inverter suppliers and power semiconductor module suppliers have jointly developed to avoid power modules that are too large and can reduce costs.
Conclusion
Today, power modules are used in most hybrid vehicles. Due to the lack of standards, the systems used by different car manufacturers are very different, so it is unlikely that these systems will be compared. In order to make the inverter system more comparable, this study used a unified "base power module" and a set of common input parameters.
To evaluate the thermal/power cycling stability that Hybrid Electric Vehicle (HEV) power semiconductor modules must have, a program was developed to calculate the temperature variations of the chip and solder layer during a particular drive cycle. By converting the thermal stress caused by the active and passive thermal stresses on the solder and the solder joints into reliability test data, the number of equivalent test cycles is calculated.
In this paper, eight different sets of parameters are compared, including different cooling conditions and/or battery voltages. The result: automotive manufacturers, inverter suppliers and power semiconductor module suppliers should jointly develop to help find cost-effective solutions by adjusting driving strategies, cooling systems, battery voltage and module cooling capabilities.
Remarks
There are some other associations between the variables used in this model, which makes the model available only to the range of test conditions for the selected data. Therefore, I strongly recommend consulting Infineon Technologies experts before applying this model.
Shenzhen Xcool Vapor Technology Co.,Ltd , http://www.xcoolvapor.com