For beginners in machine learning/data science, linear regression, or logistic regression, is the first/second way that many people come into contact when building prediction models. Because of the wide applicability of these two algorithms, some people even stubbornly believe that regression has only two forms when they go out of school as data analysts, or in other words, at least linear regression and logistic regression should be the most important of them. Algorithms. Is that really the case?

Sunil Ray is a business analyst and artificial intelligence expert with extensive experience in the Indian insurance industry. In response to this problem, he pointed out that there are innumerable forms of regression, and each regression algorithm has its own areas of expertise and its own characteristics. In this article, he will introduce the seven most common forms of regression in the simplest form. I hope that readers can try more in their studies and work after reading patience, instead of directly confronting any problems encountered. "All-purpose oil" linear regression and Logistic regression.
table of Contents
1. What is regression analysis?
2. Why use regression analysis?
3. Several common regression analysis methods
Linear regression
Logistic regression
Polynomial regression
Stepwise regression
Ridge regression
Lasso regression
ElasticNet regression
4. How to choose the appropriate regression model?
What is a regression analysis?
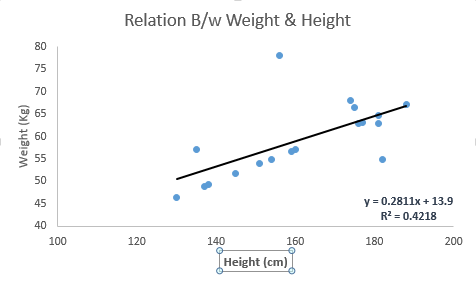
Regression analysis is a predictive modeling technique that can be used to study the relationship between dependent variables (targets) and independent variables (prediction), and is often used in applications such as predictive modeling, time series modeling, and finding relationships between variables. For example, through regression analysis, we can find out the relationship between driver speeding and the number of traffic accidents.
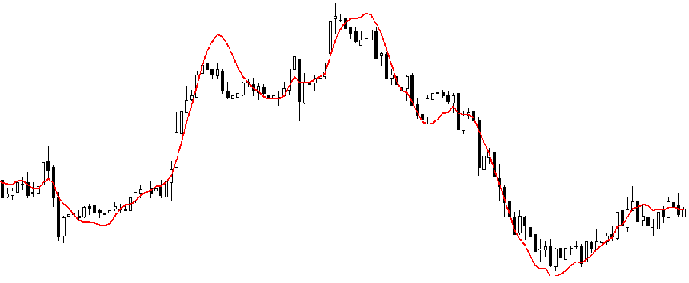
It is an important tool for modeling and analyzing data. Regression analysis is represented on the image as a curve/line segment that tries to fit all data points. Its goal is to minimize the distance between data points and curves.
Why use regression analysis?
As mentioned above, regression analysis estimates the relationship between two or more variables. We can give such an example to help understand:
Assume that A wants to estimate the sales growth rate based on the company's current economic situation, and a recent data shows that the company's sales growth is about 2.5 times the financial growth. On this basis, A can predict the future sales of the company based on various data information.
There are many advantages to using regression analysis, the most prominent of which are the following two:
It can show the significant relationship between the dependent variable and the independent variable;
It can express the different degree of influence of multiple independent variables on the dependent variable.
In addition, regression analysis can reveal the different effects of the same variable, such as price changes and promotions. It provides Market Researchers/Data Analysts/Data Scientists with predictive models that provide important variables for the assessment.
Several common regression analysis methods
There are many methods for regression analysis, but not many of them are famous. Taken together, all methods are basically driven by these three important parameters: the number of independent variables, the type of dependent variable, and the shape of the regression curve.
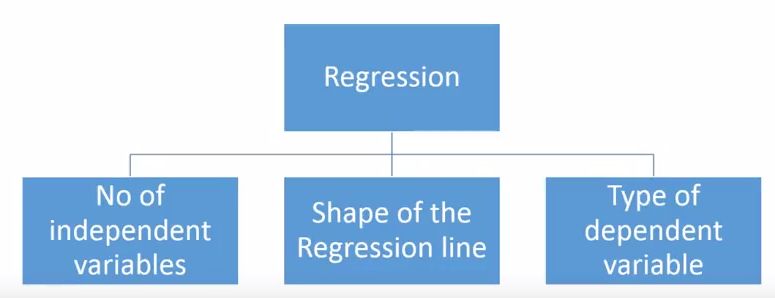
As to why these are the three points, we will make specific explanations later. Of course, for those who are creative and can independently design parameters, their models need not be limited to these parameters. This is just what most people used to do.
Linear regression
Linear regression is one of the most widely known modeling methods. Whenever it comes to creating a predictive model, it can always account for one preference. For linear regression, its dependent variables are continuous, and independent variables can be continuous or discrete. Its regression line is linear in nature.
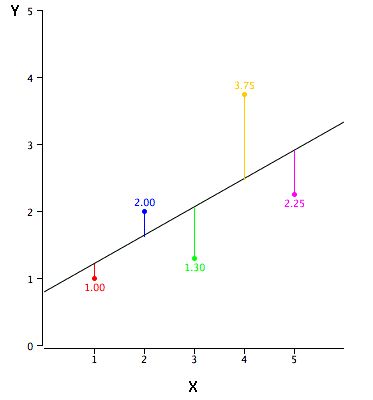
In the unitary problem, if we want to use linear regression to establish the relationship between the dependent variable Y and the independent variable X, then its regression line is a straight line, as shown in the following figure.
Its corresponding expression is: Y = a + b × X + e. Where a is the y-axis intercept, b is the slope of the regression line, and e is the error term.
But sometimes we may have more than one independent variable X, that is, a multivariate problem. In this case, the regression equation of multiple linear regression is a plane or a hyperplane.
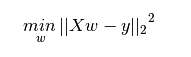
Now that we have a line, how do we determine the best-fitting regression line (the values ​​of a and b)? The most common method for this problem is the least-squares method—minimizing the sum of squares of the Euclidean distance from each point to the regression line. Due to the square, there is no positive or negative difference in distance.
Linear regression emphasis:
There must be a linear relationship between the independent variable and the dependent variable;
Multiple regression was affected by multicollinearity, autocorrelation, and heteroskedasticity;
Linear regression is very sensitive to outliers. It will seriously affect the regression line and ultimately affect the forecast value.
Multicollinearity can increase the variance of the parameter estimates and may excessively affect the least squares estimate, causing negative effects.
In the presence of multiple independent variables, we can use the forward method, backward method, and stepwise method to select the most significant independent variable.
2. Logistic regression
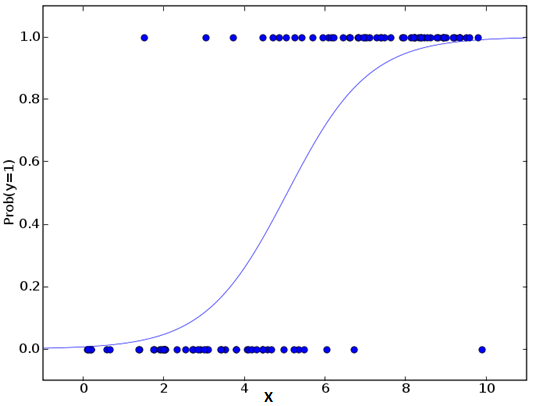
Logistic regression is generally used to determine the probability of success/failure of an event. If the dependent variable is a binary class (0/1, true/false, yes/no), then we should use Logistic regression. Its Y is a value in the range [0, 1] and can be represented by the following equation:
Odds = p/ (1-p) = probability of event occurrence/non-occurrence probability of event ln(odds) = ln(p/(1-p)) logit(p) = ln(p/(1-p)) = b0 +b1×1+b2×2+b3×3....+bk×k
In the above equation, p is the probability of the target feature. Unlike calculating the minimum of the sum of squares, here we use the maximum likelihood estimation, which is to find a set of parameters θ, so that under this set of parameters, the likelihood (probability) of the sample data is maximized. Considering that the log-likelihood function of the log-loss function and the maximum-likelihood estimate is essentially equivalent, Logistic regression uses a logarithmic function to solve the parameter.
Logistic regression key:
Logistic regression is widely used for classification problems.
Instead of relying on the linear relationship between independent variables and dependent variables, Logistic regression uses non-linear logarithm to calculate the odds ratio for prediction, so it can handle various types of problems.
To avoid over-fitting and under-fitting, Logistic regression needs to include all important variables, and then use stepwise regression to estimate the logistic regression.
Logistic regression has a high requirement on the sample size because the maximum likelihood estimation is not as good as the ordinary least squares method for datasets that are too small.
There is no multicollinearity between the respective variables.
If the value of the dependent variable is an ordinal, then it should be called an ordinal logistic regression.
If the dependent variable is more than one category, then it should be called multiple logistic regression.
3. Polynomial regression
Polynomial regression is a supplement to linear regression. Linear regression assumes a linear relationship between independent variables and dependent variables, but this assumption does not always hold, so we need to extend to nonlinear models. Logistic regression uses a nonlinear logarithmic function, while polynomial regression is a linear combinatorial polynomial that converts primary features to higher-order features.

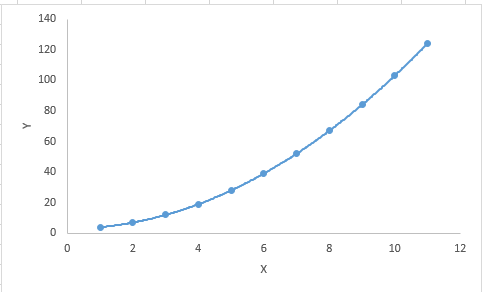
One-dimensional polynomial regression
In short, if the power of the independent variable is greater than 1, the regression equation is a polynomial regression equation, ie Y = A + B × X2. In this regression method, its regression line is not a straight line but a curve that strives to fit all data points.
Polynomial Regression Key:
Although higher-order polynomial regression can obtain lower error, it also leads to higher probability of over-fitting.
Pay attention to the direction of the curve and observe whether its shape and trend are meaningful. On this basis, gradually increase the power.
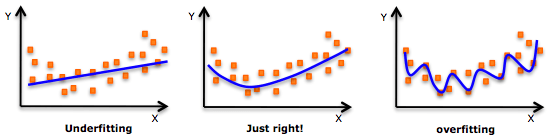
Overfitting
4. Stepwise regression
As of now, all of the above methods need to select a target independent variable X for the dependent variable Y, and then establish a “optimal†regression equation with a linear and nonlinear method to predict or classify the dependent variable. So when we are dealing with multiple independent variables, is there a regression method that can automatically filter out those important independent variables according to the size of the impact on Y?
This method is the stepwise regression introduced in this section. It uses observation statistics (such as R-squared, t-stats, and AIC metrics) to identify important variables. As a regression analysis method, the method it uses is based on a given level indicator F to add/discard variables one at a time. Here are a few common practices:
The standard stepwise regression only does two things: Add/remove variables according to each step.
Advance Method: Adds the most important variables of the remaining variables one at a time based on the most important variables in the model.
Fallback method: Based on all variables in the model, delete the least important variables one at a time.
The purpose of this modeling method is to maximize predictive power with the smallest possible number of variable predictions. It is one of the methods for dealing with higher-dimensional data sets.
5. Ridge return
When we talk about the emphasis of linear regression, we have mentioned that multicollinearity will increase the variance of the parameter estimates, and will excessively affect the least squares estimate, thereby reducing the prediction accuracy. Therefore, the variance and deviation are one of the culprit that causes the output value to deviate from the true value.
Let us first review the linear regression equation: Y = a + b × X + e.
If more than one independent variable is involved, then it is: Y = a + Y = a + b1X1 + b2X2 + ... + e
The above equation shows the significant effect of deviations and errors on the final predicted value. In order to find the trade-off between variance and deviation, a feasible approach is to add a regular term λ to the square error to solve the problem of multicollinearity. Please see the following formula:
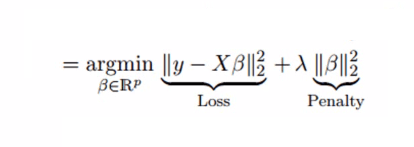
This cost function can be divided into two parts. The first part is a least-squares term. The second part is the sum of the squares of the coefficients β. It is multiplied by a tuning parameter λ as a penalty term, which can effectively control the variance and deviation changes. : As λ increases, the model variance decreases and the deviation increases.
Ridge Regression Key:
The assumption of ridge regression is the same as the assumption of least-squares regression, except for the assumption of normality.
Ridge regression can reduce the value of the coefficient, but since λ cannot be infinite, it will not be equal to zero.
This is actually a regularization method using the l2 norm.
6. Lasso regression
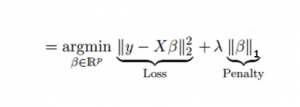
Also to solve the problem of multicollinearity, ridge regression adds a regular term λ to the square error, then Lasso's regression changes the quadratic term to an absolute value. It can reduce the impact of outliers on the model and improve overall accuracy.
A term derivation can erase the variable itself, so the Lasso regression coefficient can be zero. This can be a real feature screening effect.
Lasso Regression Key:
The assumption of the Lasso regression is the same as the assumption of the least-squares regression except for assuming normality.
The Lasso regression coefficient can be zero.
This is actually a regularization method using the l1 norm.
If a group of variables is highly correlated, Lasso's regression will select one of the variables and then change the others to zero.
7. ElasticNet regression
ElasticNet is a combination of Lasso and Ridge regression techniques. It uses the L1 and L2 norms as penalty terms. It can be used not only for sparse models with non-zero weights, but also for regularization properties. In simple terms, when there are multiple related features, the Lasso regression will only select one of the variables, but the ElasticNet regression will choose two.
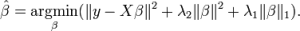
A practical advantage of trade-offs between Lasso and Ridge is that it allows Elastic-Net to inherit some of the stability of Ridge regression.
ElasticNet regression focus:
It encourages group effects in the context of highly relevant variables.
There is no limit to the number of selection variables.
Under the influence of double contraction.
In addition to the regression analysis methods commonly used in this study, Bayesian regression, ecological regression, and robust regression are some of the options that have a high rate of appearance.
How to choose the right regression model?
When you only know one or two methods, life is usually very simple. I believe many readers have heard this argument: If the results are continuous, use linear regression; if it is a binary classification, use Logistic regression. However, with more and more choices now, many people are inevitably affected by the choice of phobias and cannot make satisfactory decisions.
So how do we choose to face so many regression analysis methods? The following are some of the key factors that can be considered:
Data exploration is an integral part of building a predictive model. Therefore, before selecting the correct model, we can first analyze the data and find the relationship between variables.
In order to compare the fit of Chengdu with different methods, we can analyze statistical values ​​such as statistical significance parameters, R-square, adjusted R-square, minimum information standard, BIC, and error criterion, or Mallow's Cp criteria. Compare the model with all possible sub-models to check for possible deviations in the model.
Cross-validation is not one of the best ways to evaluate predictive models.
If you have more than one weird variable in your dataset, you'd better add it manually instead of using automatic methods.
Kill the chicken and use a chopper. Choose strong/not powerful models based on your mission.
Ridge regression, Lasso regression, and ElasticNet regression have better performance in the high-dimensional and multicollinearity cases.
ZTTEK Batteries, For 5G backup base station .Customize the lithium ion battery packs according to the application and product requirements of the customers.
Lithium ion battery integration requires a special set of skill and expertise to optimize the performance and battery life.ZTTEK Batteries , using the most advanced technology delivers the best quality battery packs.
Our batteries are safe to use, better performance, higher shelf life and a very low maintenance cost.
48V100Ah Lithium Ion Battery,Lithium-Ion Battery For Home Backup Electricity,Lithium Ion Battery 48V 100Ah,48V Lithium Iron Phosphate Battery
Jiangsu Zhitai New Energy Technology Co.,Ltd , https://www.jszhitaienergy.com