The Industrial Internet of Things starts with an edge node, which is the target entry point for detection and measurement. Today, we decompose and study the fundamental aspects of edge node detection and measurement capabilities in large IoT frameworks: detecting, measuring, interpreting, and connecting data.
Sensors form the front edge of the industrial IoT electronic ecosystem -
The measurement phase converts the detected information into meaningful data such as pressure, displacement or a quantifiable value of rotation.
In the interpretation phase, edge analysis and processing converts measurement data into actionable events. Only the most valuable information should be connected to the cloud across nodes for prediction or historical processing.
Data can be suppressed or filtered throughout the signal chain based on initial acceptability limits. Ideally, sensor nodes should only send absolutely necessary information and should make critical decisions as quickly as possible after obtaining critical data.
The edge node must be connected to the external network through a wired or wireless sensor node (WSN). In this part of the signal chain, data integrity is still critical. Optimizing detection and measurement data is of little value if communication is inconsistent, lost or damaged. Data loss during communication is unacceptable. Industrial environments with electrical noise can be very harsh and arduous, especially when radio frequency communication is present in the presence of large numbers of metal objects. Therefore, a robust communication protocol must be pre-designed during system architecture design.
Power management for ultra low power (ULP) systems begins with the selection of regulator components for maximum efficiency. However, since edge nodes may also wake up and sleep with a fast duty cycle, power-up and power-down times should also be considered. An external trigger or wake-up command can help quickly alert the edge node to start detecting and measuring data.

Figure 1. The edge node device intelligently detects, measures, and interprets data and connects it to an Internet gateway connected to the cloud. Data can be pre-processed by some form of analysis and then transmitted for deeper data mining intelligence analysis.
Data security is also an issue that must be considered in industrial IoT systems. Not only do we need to ensure that data within the edge is secure, we must also ensure that its access to the network gateway is protected from malicious attacks. It is never allowed to spoof edge nodes to gain network access for illegal activities.
Intelligence starts at the edge
There are numerous inspection solutions at the edge, and these solutions may not be just a single discrete device. There may be many different irrelevant data acquisitions at the edges. Temperature, sound, vibration, pressure, humidity, motion, contaminants, audio, and video are just some of the detectable variables that are processed and sent to the cloud through the gateway for further historical and predictive analysis.
It is no exaggeration to say that sensors are the backbone of the Industrial Internet of Things. But the more accurate statement should be that they are the central nervous system that gains insight. Edge node detection and measurement techniques are the "place of birth" of the target data. If bad or erroneous data is faithfully recorded at this stage of the solution chain, then more post-processing in the cloud will not recover the value of the loss.
Mission-critical systems, such as healthcare and plant shutdown monitoring systems with high-risk results, require robust integrity of quality data measurements. Data quality is critical. False positives or omissions can be costly, time consuming, and can even be life threatening. Costly mistakes can eventually lead to unplanned maintenance, inefficient use of labor, and even the need to disable the entire IoT system. Intelligence starts at the edge node, and the old saying goes: If the input is garbage, then the output must be garbage.

Figure 2. Many wired and wireless edge node outputs can be autonomously connected to the gateway node for aggregation before being transmitted to the cloud server.
Being able to access data treasures means taking on significant responsibilities. In traditional signal chain solutions without edge node intelligence, data is just data. Non-intelligent nodes never help generate intelligence and knowledge for making feasible decisions. There may be a large amount of raw low quality data that has no impact on system target performance. Converting all of this data and sending it to the final cloud storage destination can consume a lot of power and bandwidth.
In contrast, smart, intelligent partition edge node detection and measurement converts data into actionable information. Intelligent nodes reduce overall power consumption, reduce latency and reduce bandwidth waste. This allows reactive Internet of Things with longer delays to be transformed into a real-time predictive IoT model. The Internet of Things still applies to the basic analog signal chain circuit design philosophy. For complex systems, it is often necessary to have deep application expertise to interpret the processed data.
Optimized smart partitions maximize cloud value
Only the most important measurement information needs to be sent to the cloud through the gateway for final processing. In some cases, most of the data is not important at all. However, time-critical system data required for local real-time decision-making should be acted upon early before being aggregated into remote nodes that can be accessed remotely. Conversely, using predictive models to use historical values ​​to influence long-term insights is an ideal application for cloud processing. The power of cloud processing and storage is leveraged by archiving data into a large database for retrospective processing and decision making.
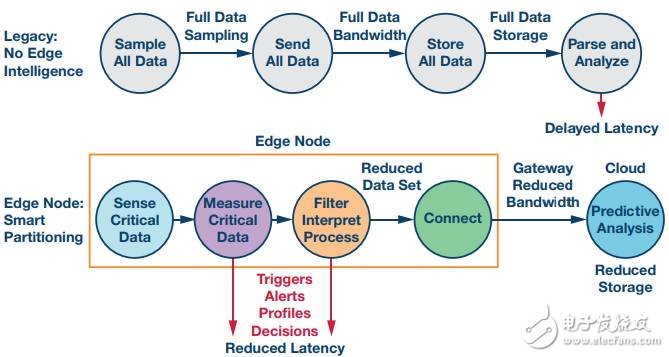
Figure 3. Intelligent partitioning of edge nodes solves new challenges that were previously unsolvable. Earlier streamlining and intelligence in the signal chain enables a more efficient overall IoT solution.
Real-time decision making depends on the edge
IoT sensors are primarily analog sensors. Specific industrial application requirements will determine the dynamic range and bandwidth of the sensors required at the front end of the edge node. The front end of the signal chain will be in the analog domain before the signal is converted to a digital representation and transmitted to the outside of the edge. If not properly selected, individual components in the analog signal chain may limit the overall performance of the edge nodes. The dynamic range will be the difference between the target full-scale sensor relative to the noise floor or the next highest unwanted signal.
Because IoT sensors typically look for both known and unknown activities, analog filters are not always meaningful. Digital filtering is performed after the signal is sampled. Unless an analog filter is used at the front end of the sensor, harmonics or other spurious signals of the fundamental wave may be mixed into the detected information and compete with the target signal for power. Therefore, in the design phase, countermeasures should be developed for unexpected detection signals in the time domain and frequency domain to prevent interference artifacts from appearing in the measurement data.
The detected information is typically measured by the next ADC in the signal chain. If discrete components are used to design the IoT edge nodes, care should be taken not to reduce the dynamic range of the sensor when selecting a measurement ADC. The input full-scale range of the embedded ADC is usually well matched to the sensor output amplitude. Ideally, the sensor output should consume almost the entire ADC input range (within 1 dB) without saturating the ADC and will not be trimmed at the range limit. However, the amplifier stage can also be used to gain or attenuate the sensor output signal to maximize the dynamic range of the ADC itself. The ADC full-scale input, sample rate, bit resolution, input bandwidth, and noise density all affect the signal measurement performance of the edge nodes.
The front-end amplifier can be embedded in the measurement stage of the node or placed as a discrete component in front of the ADC. The gain, bandwidth, and noise of the amplifier also enhance the performance of the edge nodes.
The measurement ADC behind the sensor in the signal chain typically uses one of two sampling architecture types:
Nyquist rate
Continuous time ∑-? (CTSD)
The latter is more common in embedded ADCs. The Nyquist rate ADC has a flat nominal noise floor equal to half the sampling rate frequency (ie, fs/2). The CTSD combines the oversampling rate with the notch passband to allow noise to exceed the target bandwidth, increasing the dynamic range. Measuring the ADC architecture and its resolution is critical when understanding the analog bandwidth and dynamic range of edge nodes.

Figure 4. If there is no front-end analog filter on the IoT sensor, the Nyquist rate ADC will fold the higher-order frequencies beyond the first Nyquist zone back into the target bandwidth. In contrast, the CTSD ADC architecture with oversampled modulation clocks uses noise shaping to achieve high dynamic range in the target band. Because CTSD has inherent filtering capabilities, it is less sensitive to signal aliasing.
for example
In the frequency domain, the noise density per unit Hz of 1 Hz will be based on the SNR of the ADC and the distribution width of the noise on the ADC sampling spectrum. In a Nyquist rate ADC, the noise spectral density (per 1 Hz bandwidth) is 0 dB – ADC signal-to-noise ratio (SNR) – 10 × log(fs/2), where fs/2 is the sample rate divided by two or A single Nyquist zone of the ADC.
The ideal SNR is calculated as SNR = 6.02 × N + 1.76 dB, where N is the number of ADC bits. However, the actual SNR of an ADC involves non-idealities in transistor and semiconductor processing, including electrical noise and transistor-level components. These non-ideal factors can cause SNR performance to fall below ideal performance, so consult the ADC data sheet for SNR target performance.
The dynamic range of the edge node will consist of the dynamic range of the sensor, the amplification of the signal (if needed), and the full-scale dynamic range of the ADC. If the sensor's full-scale output signal does not reach within 1 dB of the ADC's full-scale range input, some of the dynamic range of the ADC will be idle. Conversely, if the input from the sensor is outside the range of the ADC, the sampled signal will be distorted. Amplifier bandwidth, gain, and noise are also part of the consideration when calculating the dynamic range of edge nodes. The total electrical noise of the sensor, amplifier, and ADC will be the square root of the sum of the squares of the individual RMS components.
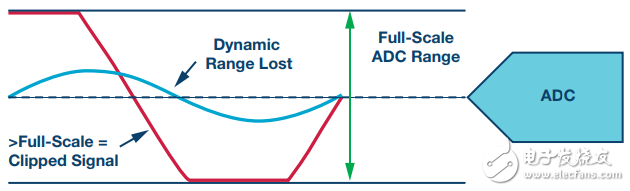
Figure 5. Example of a loss of dynamic range (blue) with a sensor signal output amplitude that does not match the ADC's input full scale. An amplifier is required to maximize the dynamic range of the sensor while preventing saturation of the ADC (red). Signal matching must consider the bandwidth, dynamic range, and noise of the entire edge node signal chain.
Smart factory
In the Industrial Internet of Things, machine vibration status monitoring will be a very important application. New or traditional machines may have multiple critical mechanical components, such as shafts or gears, which may be equipped with high dynamic range MEMS accelerometers. 8 These multi-axis sensors will sample the mechanical vibration displacement in real time. After measurement, the vibration signal can be processed and compared to the ideal machine configuration.
By analyzing this type of information in the factory, you can help improve efficiency, reduce downtime, and predict mechanical failures in advance. In extreme cases, machines with mechanical components that are rapidly deteriorating can be quickly shut down to avoid further damage.
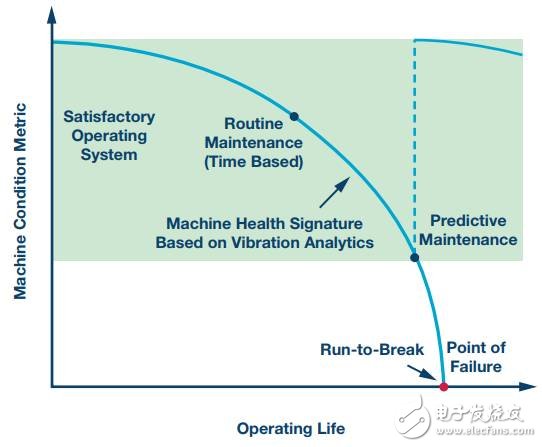
Figure 6. Although routine machine maintenance can be performed on a regular basis, this is usually not done intelligently based on machine conditions. By analyzing the vibration performance of a particular machine operation, a predicted point of failure and a maintenance milestone warning can be issued at the edge node.
By implementing edge node analysis, the decision time delay can be significantly reduced. Figure 7 shows an example in which the system immediately sends a warning after the MEMS sensor warning threshold limit is exceeded. If the event is extremely critical and is considered a critical event, the authorized node can automatically disable the offending device to prevent a very time consuming catastrophic mechanical failure.
Alternatively, a trigger signal can be invoked to enable another detection and measurement node (such as a node on the spare machine component) to begin interpreting the data based on the first event. This reduces the amount of sampled data from the edge nodes. To determine any vibration anomalies relative to the nominal value, the front end node must be designed to achieve the desired detection performance. The dynamic range, sampling rate, and input bandwidth of the detection and measurement circuitry should be sufficient to identify any offset events.
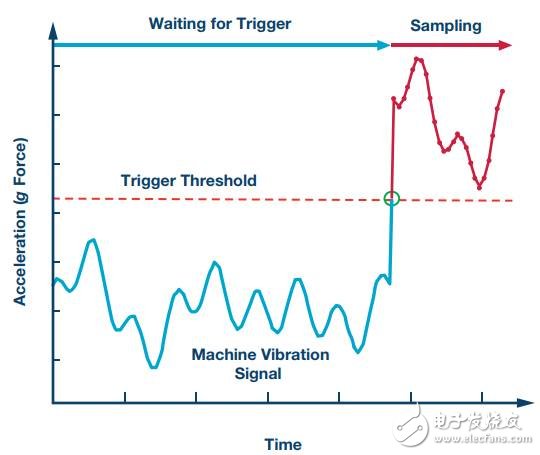
Figure 7. Time domain representation of machine vibration sample data, where the comparator threshold determines whether the detection and measurement data is passed outside the edge. The system can maintain a low power state to filter most of the information until the data advantage is achieved through threshold crossing events.
Smart city
Another industrial IoT edge node application is a smart city industrial camera with embedded video analytics. According to the definition of a smart city, the mission of the city is to bring together countless information and communication points into a cohesive system to manage urban assets.
A common application is to provide parking space vacancy reminders and occupancy detection. The field of view is pre-determined for each camera during commissioning. Boundary edge detection can be defined and used in the analysis mechanism to identify various objects and their motion. At the edge, not only can the historical motion of the object be analyzed, but a digital signal processing (DSP) algorithm can also be used to calculate the predicted path from the object trajectory.
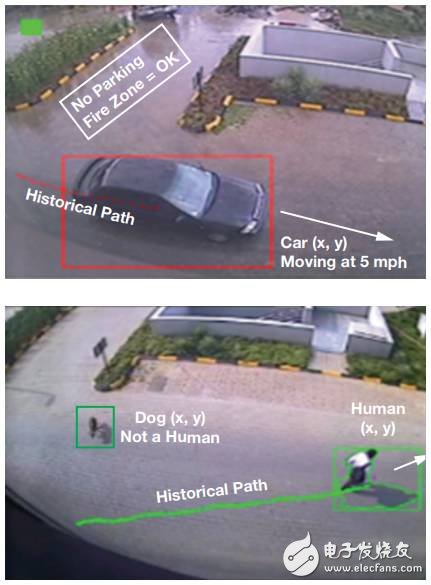
Figure 8. Edge node video analysis enables object type detection, trajectory, and boundary crossing in low-power systems without the need to send full-bandwidth video data to the cloud for analysis. Simply transfer the timestamp and trace object coordinates and type.
In similar frequency filtering, terminal processing typically does not require full bandwidth video analysis frames. Usually, when not used for security purposes, only a small portion of the full video frame is required. On a fixedly mounted camera, most of the visual data between frames is static. Static data can be filtered out. In some cases, only the boundary intersection or motion coordinates of the target object need to be analyzed. The reduced subset of information can be transmitted to the next gateway in the signal chain in the form of trace coordinates.
Edge node video analysis provides a variety of filtering interpretations to distinguish between various object types, such as cars, trucks, bicycles, humans, and animals. This decimation operation reduces the data bandwidth and computing power required on the cloud server, and if you want to analyze the full frame rate video data sent downstream, it will consume a lot of data bandwidth and computing power.
The indoor camera application can identify the number of people crossing the entrance boundary and can also adjust the lighting, heating or cooling of the room. To achieve visual effectiveness under extreme lighting conditions or other challenging lighting conditions, such as rainfall, outdoor cameras may need to have a high dynamic range. A typical imaging sensor with 8 or 10 bits per pixel may not provide sufficient brightness dynamic range under all lighting conditions in the detection situation. Slow motion frames can be used to monitor activity on industrial analysis cameras compared to viewing fast motion at 240 Hz refresh rate.

Figure 9. By deploying a high dynamic range imager with DSP object detection algorithms at the edge nodes, motion and boundary intrusion can be determined even under low lighting conditions. This example uses visual contrast to define edge detection for indoor plants/offices (left) and outdoor parking (right).
ADI platform-level solutions
ADT7420 is 4 mm × 4 mm digital temperature sensors in a breakthrough performance, built the ADC 16, a resolution of 0.0078 ° C, consumes only 210μA.
The ADXL362 is an ultra-low power, 3-axis MEMS accelerometer that consumes only 2 μA at 100 Hz sampling rate in motion-triggered wake-up mode. Instead of using a power duty cycle, it uses a full bandwidth architecture at all data rates to prevent aliasing of the input signal.
The ADIS16229 is a dual-axis 18 g digital MEMS vibration sensor with an embedded RF transceiver. It also provides on-chip frequency domain signal processing with 512-point digital FFT capability.
The DSP-enabled Blackn Low-Power Imaging Platform (BLIP) 11 enables rapid prototyping of industrial vision designs based on proven digital signal processing tools. The optimized software library provides equipment manufacturers with out-of-the-box solutions for motion detection, demographics and vehicle detection.
Ningbo Autrends International Trade Co.,Ltd. , https://www.vapee-cigarettes.com