System-on-a-chip (SoC) development is no longer just a simple silicon chip development process. Modern devices make extensive use of a variety of software, including software stacks, middleware, boot code, and drivers. You can wait until the development of the silicon chip is completed, and then put it on the circuit board to start software development. However, in the fierce market competition, time is life. The development schedule is becoming more and more urgent. If the software development can be started before the silicon chip is completed, it will become a huge competitive advantage. To do this, you need to meet the following three requirements: First, you need a set of simulation systems that can run at high speed in a register transfer level (RTL) design and run the software on top of the silicon or development board before it is ready. In addition, a high-speed, transaction-based collaborative modeling channel is required to connect the emulator to a workstation-based software debugging tool; finally, a software debugging environment that meets the needs of the software developer is required.
When developing software for a product that has not yet been formed into a hardware, you first need an environment that can run the code. There are usually two choices: physical or virtual. Most projects are based on an existing design, adding some features to the original version to make the original version more powerful, faster, and better. In this case, it is possible to obtain the ready-made board directly from the original design version of the take-over project, or to obtain the software environment of the board for software development and verify it with its own debugging environment. By far the easiest way to do this is to run on an off-the-shelf board. If you are developing a brand new software, you can use a development board. If you are lucky, you may find a similar development board. There is also a workable way to run on a virtual circuit board, such as a virtual machine (QEMU). QEMU is an open source system emulator that can simulate a variety of ARM boards at will. ARM also offers a virtual platform called the "base model" (available for free on its website), similar to QEMU, which runs ARM code. Both have tools for introducing debuggers.
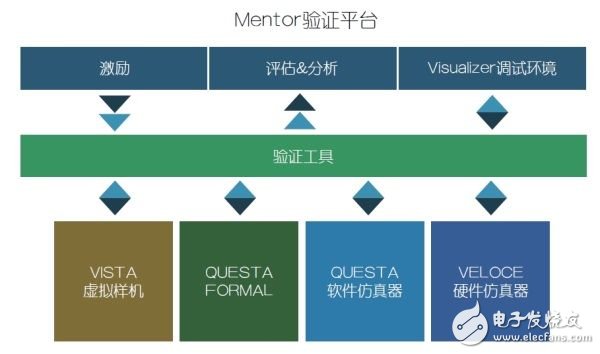
Figure 1: The Mentor verification platform combines an advanced simulator solution, hardware accelerator platform, and powerful debugging environment into a global shared high-performance data processing center resource.
With an environment in which you can run and debug your code, you can start programming. In some cases, you will need to access some new peripherals that have not yet been formed. One solution to this problem is to create a model. Let's start with a very simple example: read the ID register of this new peripheral. Many peripherals have an ID register, which is a read-only register that returns a fixed, known value when read. It's like giving the driver a little more confidence that the device is communicating with the right peripherals. Very long ago, when the driver was initialized, it was a very sensitive thing to read the registers and compare them to expectations. The following is an example of an ARM pl011 serial driver:
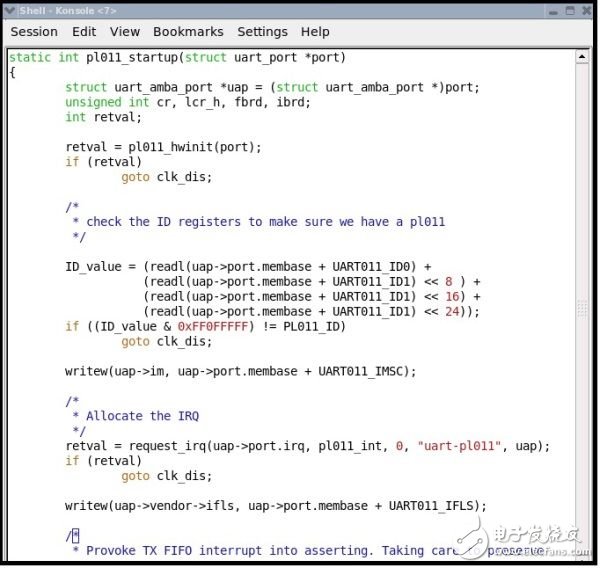
Figure 2: Verifying the ID register of a new peripheral
The driver code reads and writes registers using macros readl and writel. These drivers defined in the Linux kernel are used as a way to access the hardware. But if you start a new driver, you can redefine it locally to get the response you need. E.g:
You can start software development without having to access the actual hardware. Of course, you can also take extreme steps to model a complete peripheral, but don't try the simplest peripherals anyway, because it's easy to fail. Once the handshake fails and the sample is still in progress, the system may lose some of the return value.
If you are in a virtual environment, such as QEMU or ARM Rapid Model (AFM), a paid version of the base model, you can introduce more complex models. AFM is connected to System-C, which is an environment more suitable for modeling hardware behavior than stub-code. QEMU can also extend the model, but the experience is not out of thin air and requires many practices. Like many open source projects, code is documentation. If you use QEMU, but don't want to struggle with a mess of C code and try to figure things out, then once you need to go beyond the stub code, you may want to skip this stage.
In many cases, you can't use stub code for verification, and even the more complex System-C model you create for software operation can't do anything about it. For example, you don't know if the hardware team and the software team are using the same register map in the device. With a register that doesn't make any unexpected reactions, you can't verify that its settings are correct. If you write both the driver and the corresponding peripheral model, you can only prove that your understanding of the two is consistent.
Virtual prototyping systems, such as Mentor Graphics' Vista, can be used to create more complex models that you need. In general, these models are processed very fast and the software runs smoothly. If the hardware team created a virtual prototype model, then when running the software on the model, you can verify that the software and hardware team's design perspectives match. Usually, the design perspectives of the two are different. If you find these differences as early as possible, you can avoid a lot of trouble later in the design cycle so that you don't get crazy. In a tool that is easy to debug with both hardware and software, it is not difficult to achieve this.
The virtual prototype has a full functional model of the software peripherals you have developed. You will be able to create your own software in the same way that you create the ultimate target system, as well as access the peripheral registers as you would on real hardware. In addition, these peripheral registers can be viewed directly from the virtual prototype, making the debugging process easier without any interference. You will be able to fully write the driver and verify that it is working properly. You can even roughly calculate the total time required. However, accurate verification time calculations need to wait until the software that matches the hardware is available.
The thing to remember is that the virtual prototype is not really hardware, but just a model. The model (in the form of a program) needs to be written by the designer, but the program written by the designer occasionally makes mistakes. It's also important to note that hardware is modeled at a very abstract level, which can lead to subtle but critical differences in real hardware. Therefore, even if the driver fully validates the virtual prototype, your work is still not finished and you need to verify it in a more detailed hardware environment.
The hardware team has created an executable hardware model as part of the normal development cycle. They use a hardware description language (HDL) at the register transfer level (RTL) to describe their design. Finally, the HDL description of the design is run through a series of running compilers and parsers to create mask sets for fabricating silicon chips. The HDL runs on the simulation software and provides an accurate operating state of the clock cycle of the hardware to be produced. The only problem is that most of the physical design simulators described in HDL can only operate at frequencies of tens or hundreds of hertz, and it is difficult to achieve megahertz or even kilohertz. For software programmers, this frequency Low is almost useless. The same HDL can be used to write programmable logic (FPGA) or hardware accelerators such as Veloce from Mentor Graphics. FPGAs and hardware accelerators implement the behavior described by HDL, but they run at megahertz. For software engineers, this speed is still not enough, but at least it is available.
Once you've used the stub code and the full functionality of the virtual prototype, if one is available, the next step is to validate the code you've written on a more accurate hardware model, specifically RTL. The best way to start this step is to combine the virtual machine (QEMU or AFM) with the hardware's RTL model and run it in a soft-down emulator or hardware accelerator. Mentor Graphics' Warpcore makes this approach possible. It combines the virtual machine with the RTL execution environment and runs the RTL emulator only when the RTL is accessed. Combining virtual machines with a simulated environment and running at a few hundred hertz seems crazy, but it's feasible without over-running hardware. If the hardware only runs about one million clocks, the execution will be good. Typically, emulators are easier to set up, access, and debug. Once you need to run your hardware for more than a million clock cycles, you need to use hardware accelerators for better performance.
Running a combination of virtual machines and hardware accelerators, or some vendor's so-called "hybrid-emulation", runs software quickly and easily in one clock cycle of an accurate hardware model. Typically this configuration has a performance of 100 MHz, which is not real-time, but it is fast enough to run and debug the complete software stack.
Some simple tests can be done on the peripherals, but to thoroughly verify the driver, the peripherals only perform "loop-back", which is not enough. This means connecting it to the outside world, whether through an I/O cable on a hardware accelerator or an interface to a host connected to a virtual model or hardware accelerator. In Mentor's hardware accelerator system, it is called a co-model host. A fast and efficient connection between the co-model host and the hardware accelerator is critical to maintaining a high level of performance.
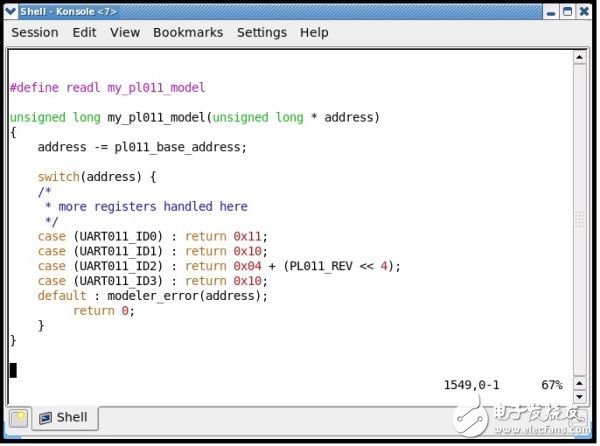
Figure 3: Re-defining read/write macros for new drivers
It should be noted that the complete design in this configuration is not in RTL. This means that the system will work properly, but will not exhibit the same performance characteristics as the final product. From this configuration you can see some aspects of performance, such as traffic flowing between certain components. However, detailed performance analysis requires a more accurate representation of the system.
When RTL represents the entire design, you get an accurate model of the entire system for one clock cycle. This can be used to perform detailed time analysis and to derive specific data for throughput, latency, and response time. For the system to work effectively, you need to put it in a hardware accelerator or FPGA prototype. A complete system that includes real software is virtually impossible to model based on software simulation. It can only run at one megahertz on a hardware accelerator platform. This far exceeds the speed of software-based simulation, but it is much slower than the actual time.
When running a design on a hardware accelerator, you need to debug the software in the embedded processor. Typically such debugging is done using a hardware interface (such as the JTAG interface) available to the system to connect to the hardware debug probe. But there is a problem: although JTAG is a good fit for debugging features, it's hard to debug performance and timing issues. Because of the higher performance of "hybrid" virtual machines and emulations, you'll want to debug all of the functional issues on top of it. Therefore, the only remaining issue is timing and performance related issues.
JTAG and similar debugging techniques put the processor into debug mode and then use various techniques to retrieve data from the processor and peripheral registers. Even in the best case, these operations require at least tens of thousands of clocks—typically millions of clocks. And these debug clocks are usually only a small part of the processor clock. Because debugging tools introduced delays of millions of operating clocks before and after the debug time point, debugging performance and timing issues became extremely difficult. Developers typically track back and forth through the processor to avoid delays. But even collecting processor trace data can affect the operation of the system you are watching.
Mentor Graphics has a product called "Codelink" that collects traceback data when running a design in a simulation, which can be used to drive traditional software debugging. Essentially, you get all the power of traditional software debugging—stepping code, setting breakpoints, and looking at memory and variables. This preserves the accuracy of the clock cycle of the simulation system without any side effects. You also have full parallel multicore visibility and the ability to run and roll back. However, many performance issues are difficult to debug at the source code level, and usually require an action timeline view of the processor running in the design that compares hardware actions. Codelink collects these tracking data and imports it into Mentor's system analysis tool to display performance data and hardware data. To diagnose the entire design at this stage of development, this may be the best solution for visualizing performance and timing issues.
FPGA prototypes typically run faster than hardware accelerators, so longer software runtimes are achievable and more design issues may be discovered. Software debugging is usually implemented using JTAG or similar technology, but all of the above problems exist. In hardware debugging, FPGAs have always had the disadvantage of limited visibility. Embedded logic analyzers from FPGA vendors can only provide limited tracking amplitudes and shallow tracking depths as well as frequent re-measurements, resulting in long, often abrupt ("back to origin") recompilation (comprehensive And P&R). This makes debugging in the FPGA painful and boring. Fortunately, new technologies are available that not only provide a visible view of thousands of signals, but also the ability to drill down into chip and system-level actions, yet offer unprecedented ease of use and powerful runtime configurability. Sexuality can greatly improve debugging efficiency by eliminating the need for most re-measurement and iterative iterations. Improved debugging will have a positive impact on the experience and efficiency of using FPGA prototypes.
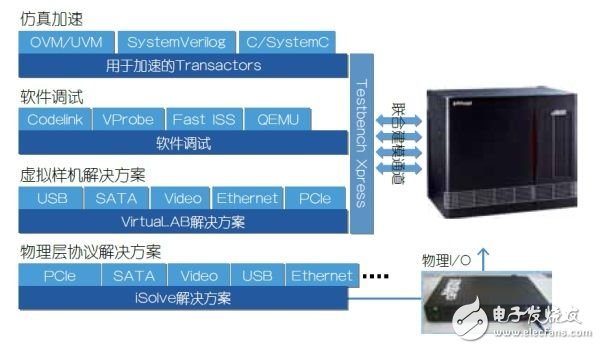
Figure 4: Hardware accelerators are becoming more than just accelerated simulations.
Starting with simple stub code, advance through a series of more detailed and complete hardware models, the software can be verified before the actual hardware chip is obtained. You can maintain the highest performance and the easiest to use debugging environment for a long time, using detailed models to verify all aspects of the system if necessary. You will need a common environment to build, run, and debug to seamlessly transform with other environments. And this will also be extended to the final chip, because you will need to do a final test on the actual product. This means that once you get the physical prototype, all you need to do is confirm that all the features are working. For the hardware abstraction model and the later RTL hardware model with precise clock cycles, the most difficult hardware and software interaction problems will be solved during the design phase. Once the physical prototype is ready, the time for software development can be greatly reduced.
General-purpose rectifiers belong to the most widely used category of rectifiers, and their classification is relative to those with special functions, such as fast, high-frequency, and so on.
Our universal rectifiers are of original quality, complete models, high visibility, affordable prices, and fast shipping!

Rectifiers,General Purpose Rectifiers,Rectifier Diode,General Purpose Rectifier Diodes
Changzhou Changyuan Electronic Co., Ltd. , https://www.cydiode.com